

The Hidden Cost of the AI Revolution: How Data Centers Are Reshaping America’s Electricity Bills#
American households are facing an electricity crisis that few saw coming. The numbers tell a stark story: since February 2020, electricity prices have surged 40%—outpacing the 26% rise in overall inflation by 14 percentage points. The consequences are quantifiable and dire: 14 million households are now behind on their utility bills with an average overdue balance of $789 (up 32% from 2022). In New York City alone, disconnection rates have increased 500% in just one year. As winter approaches and heating demands intensify, millions of Americans are bracing for bills they cannot afford.
At the heart of this crisis lies an unlikely culprit: the data centers powering our AI revolution. The statistical trajectory is alarming. Data centers consumed 4.4% of U.S. electricity in 2023, but the Department of Energy projects this will surge to between 6.7% and 12% by 2028—a potential 173% increase in just five years. Since ChatGPT’s launch in November 2022, only 4 states (Louisiana, New Hampshire, Kentucky, and Nevada) have avoided electricity price increases. In areas near significant data center activity, residential electricity bills have increased by as much as 267% over five years. The PJM grid, serving 65 million people from Illinois to Washington D.C., has seen costs rise by $9.4 billion (a 180% increase), with expenses passed directly to consumers. In Ohio, households now pay an additional $15 per month solely due to data center demand, with Carnegie Mellon projecting a 25% increase in Virginia bills by 2030.
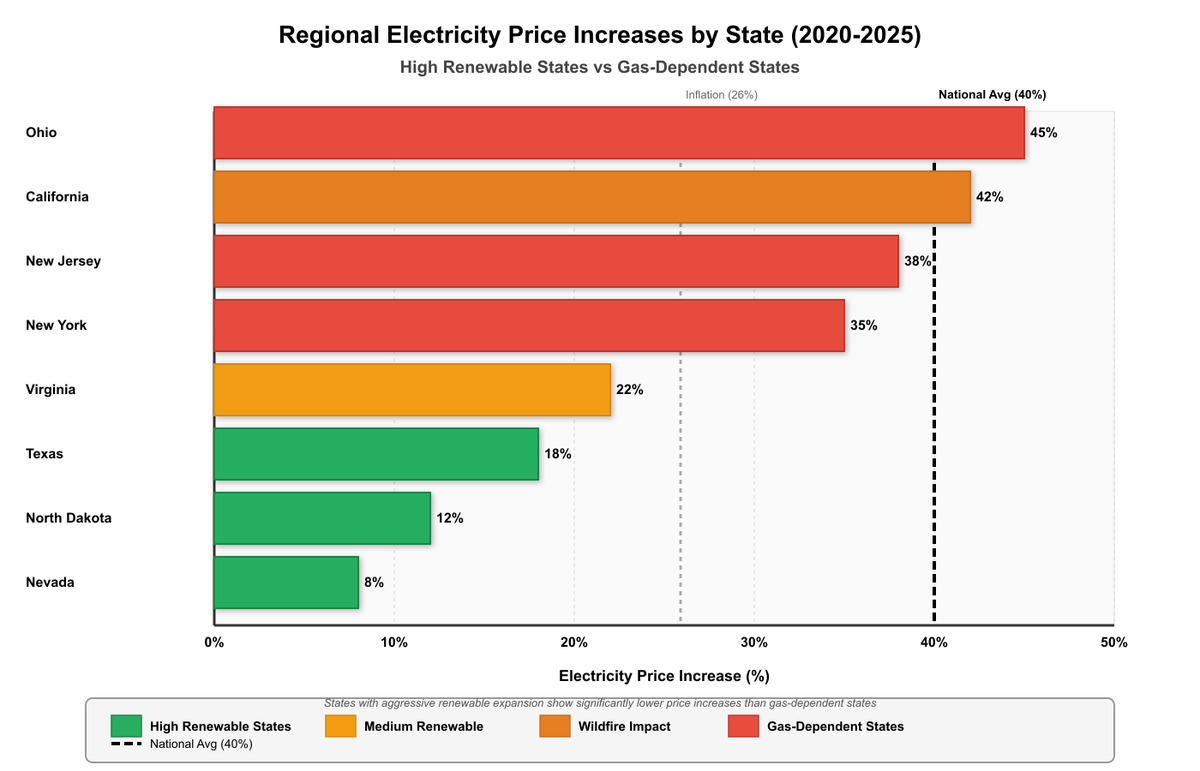
Yet the story is more nuanced than simply blaming data centers. The data reveals that regional energy policy and natural disasters matter as much as, if not more than, data center proliferation. Among the 22 states with above-average increases in wind and solar generation over the past four years, 12 states (55%) recorded power price hikes below the national average. This correlation is statistically significant.
Consider the extremes: Nevada and North Dakota have kept residential price increases to just 8-12% through aggressive wind and solar expansion. Texas and Virginia, despite absorbing massive data center growth (Texas hosts the second-most data centers nationally), have seen only 18-22% increases. Meanwhile, California—despite heavy renewable investment—has experienced 42% increases due to wildfire damage requiring infrastructure rebuilds. The Northeast tells an even starker story: New York and New Jersey have seen 35-38% increases driven by blocked pipeline projects, closed nuclear plants (including Indian Point, which provided 25% of NYC’s power) and reliance on increasingly expensive imported natural gas.
The Inequality Embedded in the System#
What makes this crisis particularly quantifiable is the inequality baked into rate structures. Industrial electricity costs have risen significantly slower than residential rates with large technology companies negotiating special deals that residential customers can never access. The disparity is stark in real-world cases:
In Columbus, Ohio, a landmark regulatory case illuminates this power imbalance. The utility company has already committed to supplying electricity for 30 data centers by 2030 pushing consumption to levels comparable to Manhattan. Now, tech companies are demanding approval for 90 additional data centers, which would make Columbus’s peak consumption comparable to the entire state of New York during summer. Meanwhile, residential customers absorb the $15 monthly increase with no seat at the negotiating table.
The nation’s most power-hungry data center exemplifies this asymmetry. Meta’s Sarpy County, Nebraska facility consumes an estimated 794,440 MWh annually—enough to power approximately 73,000 average American homes for an entire year. Meta secured the entire 320 MW output of Enel’s Nebraska wind farm in 2018, effectively cornering local renewable supply before residential demand could grow. When the company announced expansions just before ChatGPT’s launch, it was converting farmland into computational infrastructure that serves global users while local residents bear rising utility costs without preferential access to renewables.
The U.S. electric grid’s utilization statistics reveal another dimension of this crisis. On typical days, only 50% of U.S. electrical capacity is in use, with even the most efficient gas plants running less than 60% of the time. This slack exists by design to handle peak demand during extreme weather. Research demonstrates that if data centers curbed demand just 0.25% of the time—approximately 22 hours per year—the United States could accommodate significantly more data centers without burdening household electricity users. Yet without regulatory mandates, companies have little incentive to absorb even this minimal curtailment.
Three Statistically-Supported Pathways Forward
Accelerate Green Energy Production#
The correlation between renewable expansion and price stability is empirically clear. States with above-average wind and solar growth showed a 55% likelihood of below-average price increases. Stanford professor Mark Jacobson’s research demonstrates that renewable electricity generators and batteries reduce energy prices versus fossil fuels even when accounting for other cost factors. From 2008 to 2020, U.S. residential electricity prices remained flat as solar installation costs dropped 89% and wind costs fell 70%. The current administration’s restrictions on renewable development directly contradict this evidence-based approach.
Mandate Data Center Peak Demand Reduction#
The mathematics are straightforward: with 50% average grid utilization and data centers consuming 6-12% of total electricity, requiring curtailment during just 22 hours annually (0.25% of time) could accommodate growth without residential impact. The Department of Energy’s October 23, 2025 directive to the Federal Energy Regulatory Commission proposes exactly this, with bipartisan support reflecting the empirical strength of the case. Implementation through batteries, on-site generation, or demand-shifting represents a statistically minimal burden on operators with maximal benefit to residential users.
Establish Utility Consumer Unions with Measurable Power#
Large corporations negotiate rates; residential customers—representing 38% of total U.S. electricity consumption but 100 million+ households—remain atomized and powerless. Organizations like the National Association of State Utility Consumer Advocates (NASUCA) exist but lack systematic efficacy measurement. Creating collective bargaining mechanisms modeled on labor unions, with measurable advocacy outcomes and credible threat capacity, would address the $789 average arrears and 14 million households in collections through structural power rebalancing rather than individual appeals.
The ultimate irony emerges from long-term projections: we need far more electricity for the future we’re building. Electric vehicles, heating systems, and appliances necessary for decarbonization will increase residential demand by an estimated 38% by 2035. AI and data centers will drive additional industrial growth. Yet from 2008 to 2020, we proved that expansion and affordability can coexist—residential prices remained flat while consumption grew 5% and renewable capacity increased 300%.
The question before policymakers is not whether to build this electrical future, but who pays for it. Currently, 14 million households are in arrears, disconnection rates are spiking 500% in major cities, and residential bills are rising 54% faster than industrial rates (40% vs 26%). The data shows three interventions—renewable expansion, peak demand reduction and consumer unions—that could reverse these trends. The statistical evidence is clear. The political will remains the variable.
Crisis Metrics: 40%: Residential electricity price increase since Feb 2020 (vs 26% inflation) 14 million: Households in arrears or collections $789: Average overdue utility balance (↑32% from 2022) 500%: Increase in NYC disconnections year-over-year
Data Center Impact: 4.4% → 12%: Data center share of U.S. electricity (2023 → 2028 projection) 173%: Projected consumption increase over 5 years 267%: Maximum residential bill increase in high data center areas $9.4 billion: Cost increase on PJM grid (serving 65M people) 794,440 MWh/year: Consumption of largest U.S. data center (Meta, Nebraska) 73,000 homes: Equivalent annual power for Meta’s single facility
Policy Outcomes: 4 states: Without electricity price increases since ChatGPT launch (Nov 2022) 55%: States with high renewable growth showing below-average price increases 50%: Average U.S. grid utilization (showing slack capacity) 22 hours/year: Time data centers would need to curtail to accommodate growth 0.25%: Percentage of annual time representing minimal curtailment burden
Grid Inequality: 30 data centers: Already committed in Columbus, OH (= Manhattan consumption) 90 additional: Requested by tech companies (= entire NY state peak consumption) 54%: How much faster residential rates rise vs industrial rates
Analysis based on data from the U.S. Department of Energy, Bureau of Labor Statistics, Bloomberg, Carnegie Mellon University, PJM Connection independent monitor and utility company regulatory filings (2020-2025)